 What Are ResearchGate Metrics?
ResearchGate Metrics are a set of quantitative indicators provided by ResearchGate — one of the world’s largest academic social networks — that assess a researcher’s visibility, influence, and engagement within its platform.
They help scholars understand how their publications perform in terms of reads, citations, recommendations, and interaction with other scientists.
Core ResearchGate Metrics Explained
| Metric | Description | Significance |
|---|---|---|
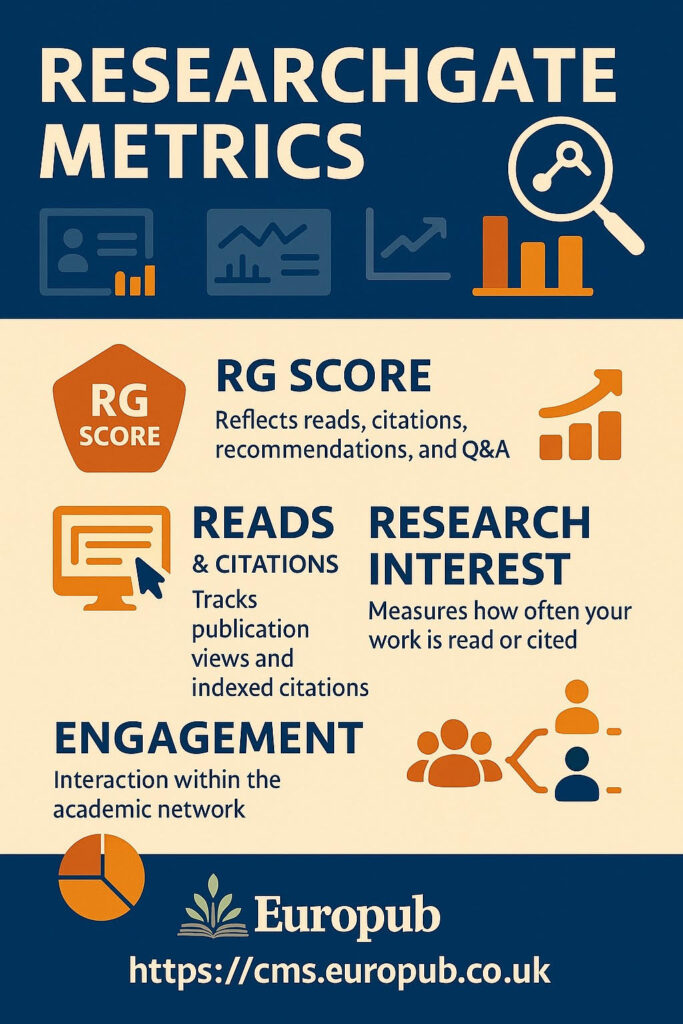
| RG Score | Composite score reflecting engagement, reputation, and quality of contributions on ResearchGate. | Indicates overall research visibility and interaction quality. |
| Research Interest Score | Measures how often a researcher’s work is read, cited, or recommended in a given field. | Tracks subject-specific influence. |
| Reads | Number of times a publication has been accessed or read on ResearchGate. | Indicates readership engagement. |
| Recommendations | How many users have “recommended” your paper. | Reflects peer endorsement. |
| Citations | Number of times your work has been cited by other ResearchGate members or indexed references. | Academic recognition. |
| Followers / Following | Number of researchers who follow your updates. | Shows community reach. |
| Questions & Answers Activity | Measures scholarly interaction and contribution to community discussions. | Reflects knowledge-sharing behavior. |
| Full-text Availability | Percentage of your uploaded works available for open access. | Higher availability increases visibility and citation potential. |
How ResearchGate Calculates the
RG Score
The RG Score is not a citation metric only. It’s calculated using:
- Publication impact (reads, citations, recommendations)
- Engagement with the community (answers, questions, collaborations)
- Network quality (who interacts with your work)
- Recency and consistency of activity
Example: A researcher with 10 high-read, high-cited papers and active Q&A participation will have a higher RG score than someone with the same publications but no engagement.
How ResearchGate Metrics Differ from Traditional Metrics
| Aspect | ResearchGate Metrics | Scopus / WoS Metrics |
|---|---|---|
| Source | ResearchGate platform data | Indexed journal databases |
| Speed | Real-time updates | Delayed (quarterly or annual) |
| Scope | Includes reads, recommendations, Q&A | Citations only |
| Audience | Academics + students + professionals | Academics only |
| Engagement | Social and interactive | Bibliometric |
Why These Metrics Matter
- Measure online academic influence instantly.
- Discover real-time readership by region, field, and institution.
- Support visibility for grants, promotions, or collaborations.
- Complement Scopus and Web of Science citation analytics.
- Encourage open science through sharing and discussion.
Best Practices to Improve ResearchGate Metrics
- Upload all your publications (full-text when possible).
- Add accurate metadata: title, abstract, DOI, keywords.
- Engage in Q&A forums to increase community visibility.
- Follow and collaborate with researchers in your field.
- Regularly update your project and dataset summaries.
- Encourage peers to recommend your papers.
- Link your ORCID ID for data verification.
- Cite your ResearchGate uploads properly in other works.
Integrations & Tools
 ResearchGate.net
- ORCID Integration
- Google Scholar
- Scopus Author ID
- Publons / Web of Science Profiles
- https://cms.europub.co.uk
 FAQ – Frequently Asked Questions
1. What is considered a good RG Score?
Anything above 30 is considered above average; top researchers may have > 40–60, depending on activity and field.
2. Does RG Score reflect research quality?
Not fully — it indicates online engagement, not peer-reviewed impact alone.
3. How can I increase my RG Score quickly?
Upload open-access versions of your papers and engage in Q&A discussions regularly.
4. Why does my RG Score drop over time?
Because it decays without regular activity — consistent engagement keeps it stable.
5. Are citations on ResearchGate official?
No — they reflect ResearchGate’s internal database and may differ from Scopus or WoS.
6. Can institutions use RG Scores for promotion?
They shouldn’t rely solely on it; RG is complementary to traditional metrics.
7. What is “Research Interest”?
It quantifies how much attention your work receives in a specific field — similar to an “engagement score.”
8. Can I import publications automatically?
Yes, via DOI, PubMed ID, or upload from a RIS/BibTeX file.
9. Does ResearchGate track book chapters and conference papers?
Yes, if uploaded and tagged correctly.
10. Are fake profiles or duplicate papers common?
Sometimes — always verify co-authors and publication sources for accuracy.
11. What is the difference between RG Reads and Views?
- Reads: User viewed the abstract or full text.
- Views: User opened the publication page.ResearchGate combines both in total reads count.
12. Do ResearchGate metrics affect citations in Scopus or Google Scholar?
Indirectly — higher exposure can lead to more legitimate citations over time.
13. How can journals use ResearchGate metrics?
Editors may analyze which topics gain traction for future special issues or CFPs.
14. Are RG metrics public?
Yes, most are visible on your profile, but you can control visibility in settings.
15. Can Altmetrics and ResearchGate metrics be compared?
They overlap — both capture attention beyond citations, but Altmetrics uses external data sources.