Introduction
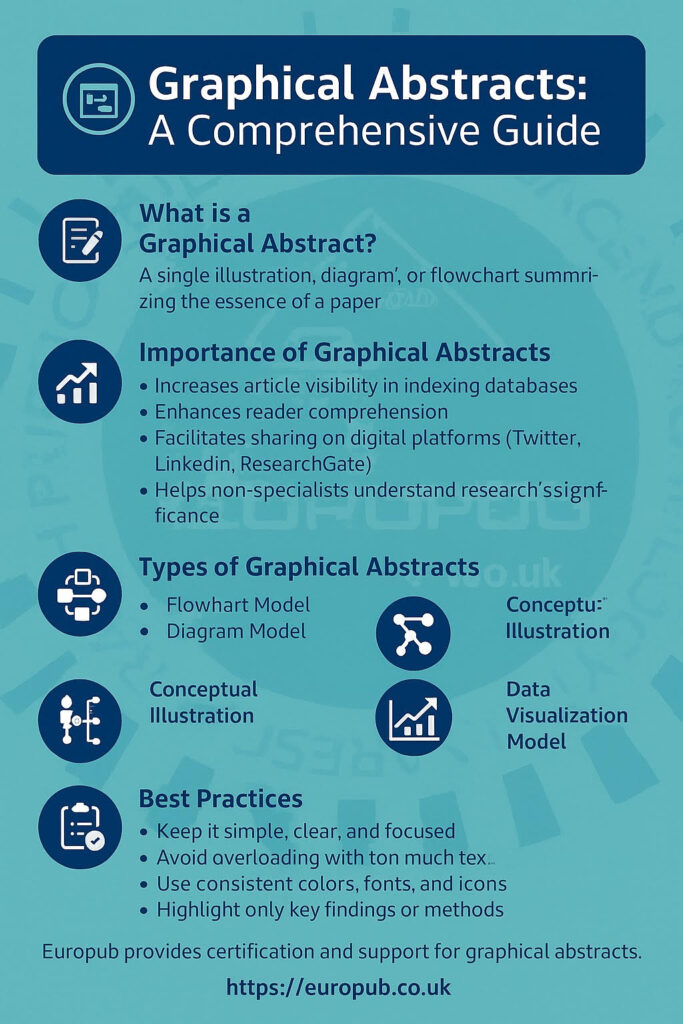
A graphical abstract is a visual summary of a research article that conveys the key findings in a single image. It is designed to quickly attract attention, improve comprehension, and increase the visibility of a paper in academic databases and social media.
Leading publishers such as Elsevier, Springer, Wiley, and Nature encourage or require graphical abstracts for journal submissions.
What is a Graphical Abstract?
- A single illustration, diagram, or flowchart summarizing the essence of a paper.
- Replaces or complements traditional text-only abstracts.
- Helps researchers grasp the main idea at a glance.
Importance of Graphical Abstracts
 Increases article visibility in indexing databases.
Enhances reader comprehension.
Facilitates sharing on digital platforms (Twitter, LinkedIn, ResearchGate).
Helps non-specialists understand research significance.
Types of Graphical Abstracts
- Flowchart Model
- Shows research process step by step.
- Example: Clinical trial design stages.
- Diagram Model
- Summarizes results in schematic format.
- Example: Biological pathways or engineering systems.
- Conceptual Illustration
- Uses simple icons and symbols.
- Example: Environmental impact of renewable energy.
- Data Visualization Model
- Emphasizes charts, graphs, and infographics.
- Example: Survey data trends.
Best Practices for Creating Graphical Abstracts
Keep it simple, clear, and focused.
Avoid overloading with too much text.
Use consistent colors, fonts, and icons.
Highlight only key findings or methods.
Follow publisher guidelines (Elsevier: 500×1200 pixels, readable fonts).
Tools for Graphical Abstracts
- Canva → Easy infographic design.
- Adobe Illustrator → Professional illustrations.
- BioRender → Specialized for life sciences.
- Microsoft PowerPoint → Quick diagrams and flowcharts.
Example of a Graphical Abstract
Topic: Effect of Exercise on Brain Function
- Left side: research design (participants, methods).
- Middle: process (exercise training).
- Right side: outcome (improved memory and brain activity).
Common Mistakes
 Too much text (defeats purpose).
Poor image quality (affects readability).
Overly complex diagrams.
Ignoring journal’s specific size and format requirements.
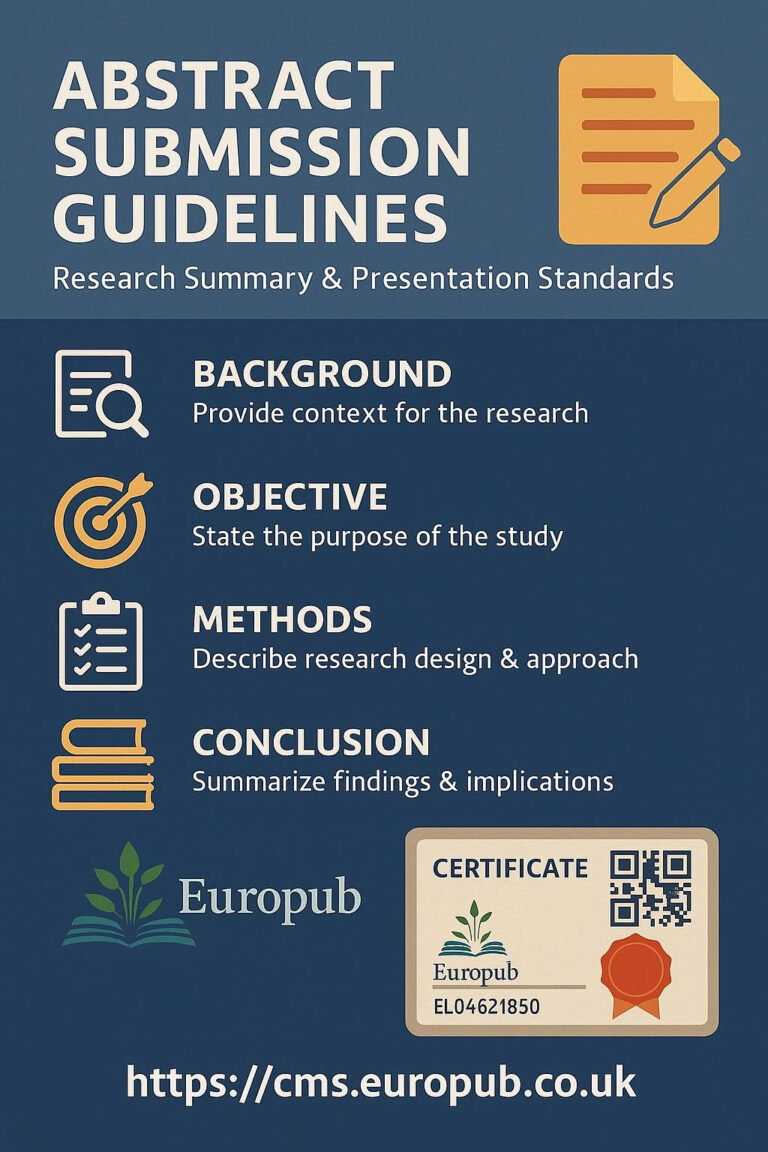
Europub Certification & Guidance
Europub provides Graphical Abstracts & Academic Visualization Certificates via its Certificate Management System:
 Certificate of Scientific Visualization Skills
Certificate of Graphical Abstract Design
With Europub certification, you can:
- Improve publication chances in high-impact journals.
- Communicate findings effectively through visuals.
- Enhance visibility and citation rates.
 Apply here: https://cms.europub.co.uk
 Main site: https://europub.co.uk
 Newsletter: https://news.europub.co.uk
 Europub experts also provide tailored support for creating high-quality graphical abstracts aligned with Scopus and ISI standards.
 Frequently Asked Questions (FAQs) on Graphical Abstracts
1. Do all journals require graphical abstracts?
Answer: No, but many top publishers strongly encourage them.
2. What size should a graphical abstract be?
Answer: Depends on publisher: Elsevier recommends 500 x 1200 pixels.
3. Should I include text in a graphical abstract?
Answer: Minimal text only. Focus on visual communication.
4. Can I create a graphical abstract without design skills?
Answer: Yes. Tools like Canva or BioRender make it accessible even for beginners.
5. Do graphical abstracts increase citations?
Answer: Yes, studies show that articles with graphical abstracts get higher visibility and more downloads.
 Reference: Elsevier – Graphical Abstracts Guide
Conclusion
Graphical abstracts are a powerful tool for communicating complex research quickly and effectively. By combining clarity, creativity, and scientific accuracy, they increase impact and visibility. Europub enhances this process by providing certifications and expert support for academic visualization.