Introduction
Once researchers have collected their data, the next crucial step is analysis. Data analysis is the process of systematically applying statistical, logical, and computational techniques to describe, summarize, and evaluate data. The approach chosen depends on the research design, type of data (qualitative or quantitative), and study objectives.
What is Data Analysis?
Data analysis involves organizing, interpreting, and drawing conclusions from data to answer research questions or test hypotheses.
It can be broadly divided into:
- Qualitative data analysis → focused on meanings, patterns, and themes.
- Quantitative data analysis → focused on numerical patterns, relationships, and statistics.
Importance of Data Analysis
- Transforms raw data into insights.
- Tests hypotheses and validates research objectives.
- Supports decision-making in academia, business, and policy.
- Improves credibility and generalizability of results.
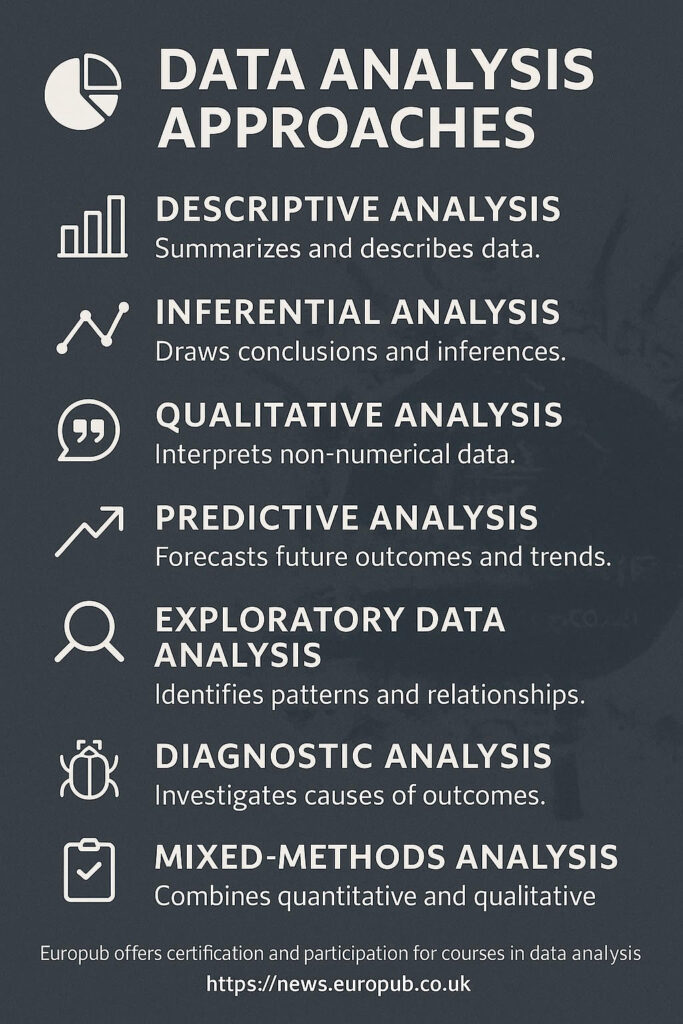
Major Data Analysis Approaches
1. Descriptive Analysis
- Purpose: Summarizes and describes data.
- Methods: Mean, median, mode, frequency distributions, charts.
- Use: Initial exploration of datasets.
2. Inferential Analysis
- Purpose: Makes predictions or inferences about a population based on a sample.
- Methods: Hypothesis testing, ANOVA, regression analysis, chi-square.
- Use: Testing theories and relationships.
3. Qualitative Analysis
- Purpose: Interprets non-numerical data (interviews, open-ended surveys, observations).
- Methods: Thematic analysis, grounded theory, content analysis.
- Use: Social sciences, education, cultural studies.
4. Predictive Analysis
- Purpose: Uses historical data to forecast future outcomes.
- Methods: Machine learning models, regression, classification.
- Use: Business, health sciences, risk management.
5. Exploratory Data Analysis (EDA)
- Purpose: Identifies patterns, anomalies, or hypotheses without prior assumptions.
- Methods: Data visualization, correlation matrices, scatterplots.
- Use: Early stages of research.
6. Diagnostic Analysis
- Purpose: Explains why something happened.
- Methods: Root cause analysis, comparative analysis.
- Use: Medical studies, failure analysis.
7. Mixed-Methods Analysis
- Purpose: Combines quantitative and qualitative approaches.
- Use: Complex social and behavioral research.
Tools for Data Analysis
- SPSS, SAS, STATA → Statistics.
- R, Python → Programming & advanced analytics.
- NVivo, ATLAS.ti → Qualitative analysis.
- Excel, Google Sheets → Basic analysis.
- Tableau, Power BI → Data visualization.
Best Practices
 Clean and preprocess data.
Choose the right statistical tests.
Document methodology for transparency.
Visualize results for better communication.
Use multiple approaches if necessary (triangulation).
Common Mistakes
 Misinterpreting statistical significance.
Overgeneralization of small samples.
Ignoring confounding variables.
Failing to check data quality before analysis.
Real-Life Example
In a clinical trial for a new drug:
- Descriptive analysis summarized patient demographics.
- Inferential analysis tested differences in outcomes.
- Predictive analysis forecasted side effects in different populations.
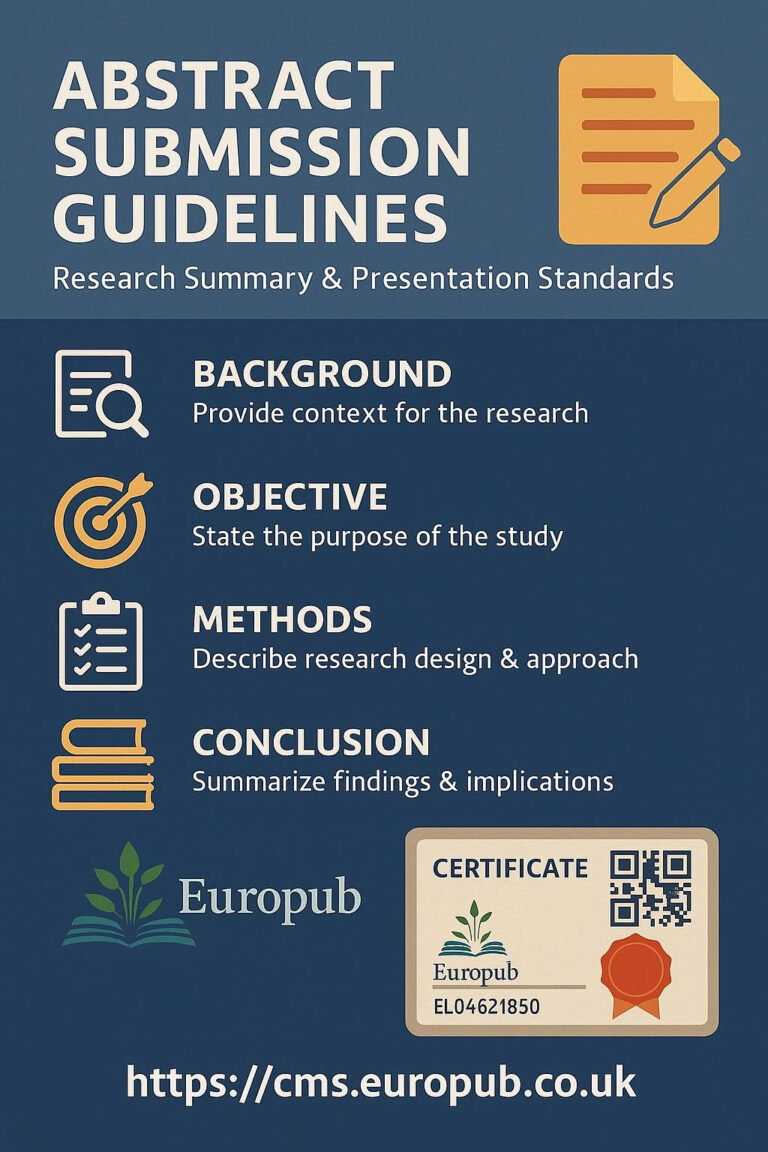
Europub Certification & Guidance
Europub provides Certificates in Data Analysis Competency through its Certificate Management System:
- Certificate of Statistical Analysis Skills.
- Certificate of Qualitative Data Interpretation.
- Certificate of Mixed-Methods Analysis.
 Apply here: https://cms.europub.co.uk
 Main site: https://europub.co.uk
 Newsletter: https://news.europub.co.uk
 Researchers can also consult Europub experts for personalized guidance in statistical testing, qualitative interpretation, and reporting standards.
 Frequently Asked Questions (FAQs) on Data Analysis Approaches
1. What is the difference between descriptive and inferential analysis?
Answer:
- Descriptive analysis summarizes data (e.g., averages, percentages).
- Inferential analysis tests hypotheses and predicts population outcomes based on a sample.
 Reference: Scribbr – Descriptive vs Inferential Statistics
2. When should I use qualitative vs. quantitative analysis?
Answer:
- Qualitative → when studying meanings, opinions, behaviors (e.g., interviews).
- Quantitative → when measuring relationships and testing hypotheses with numerical data.
Reference: Sage Research Methods
3. What software is best for beginners in data analysis?
Answer:
- For quantitative: Excel, SPSS.
- For qualitative: NVivo.
- For visualization: Tableau.
4. What is the role of Exploratory Data Analysis (EDA)?
Answer:
EDA helps detect patterns, trends, or anomalies before applying complex statistical tests, often using graphs and plots.
Reference: Towards Data Science – EDA Guide
5. How do I ensure my data analysis is valid?
Answer:
- Use appropriate methods for your data type.
- Ensure sample size is adequate.
- Control for confounding variables.
- Report results transparently.
6. What is predictive analysis?
Answer:
Predictive analysis uses historical data and statistical models to forecast future outcomes. It is widely used in business, healthcare, and education.
Reference: IBM Predictive Analytics
7. What are common mistakes researchers make in data analysis?
Answer:
- Misinterpreting p-values.
- Using the wrong statistical test.
- Failing to preprocess data.
- Ignoring assumptions of tests (e.g., normality).
8. Can I combine qualitative and quantitative analysis?
Answer:
Yes. This is called mixed-methods analysis, where numbers explain scale, and qualitative data explains depth.
Reference: Scribbr – Mixed Methods
Conclusion
Data analysis approaches form the core of scientific discovery. Choosing the right approach ensures that research findings are valid, reliable, and impactful. Europub supports researchers with certification, tools, and expert consultation to help them succeed at the highest academic level.